8. Color Display
8.1. Color Mapping
For the 3D display (Athos Render View or Render View), attributes can be chosen for the visualization, with the effect that automatic color mapping will be applied:
The full value range of the attribute will be calculated, and a predefined default color scale will be mapped to that value range.
A legend will be shown that explains the value mapping to colors.
All the above can be adapted by the user, from the value range via the color palette to the visibility and location of the legend.
Hint
Automatic color mapping also works for attributes that are categories with names, like geological unit names. In this case, the value strings will appear in alphabetical sort order in the legend.
This may not always be the desired ordering, i.e. in the case of geological units that would better appear in an order from top to bottom. Right now the only way to achieve this is to prepend the names with a letter or number like this:
A Upper Limestone
B Upper Shale
C Lower Limestone
etc.
8.2. Direct Color Display
Much less obvious is the fact that colors can also be directly assigned to either points or cells (model blocks, topo triangles etc.). This works with attributes that have 3 components, representing the Red, Green and Blue color components.
If the attribute is of an integer data type (i.e. no fractions), these color component values are assumed to be in the value range between 0 and 255. If the attribute is of a floating point type (float or double), the value range must be between 0.0 and 1.0 to cover the full color space.
Finally it is important to turn off the Map Scalars option in the Display panel to get the desired color display - see Fig. 8.1.
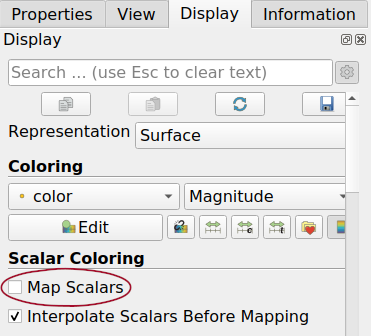
Fig. 8.1 By default, automatic attribute to color mapping is always active and very useful. However, if specific colors are coded in an attribute (3 components, representing red, green and blue), it has to be turned off explicitly in the Display panel.
8.2.1. Example: The Fixed Colors from Categories Filter  
As mentioned above, the default display of AthosGEO View handles also attributes of category type, like codes, names or labels, assigning each one a unique color. However, if more control of the colors is required (and a legend is of less importance), here is a filter that assigns explicit colors to data items by category.
A possible use case: Some well known standard coloring for well known categories, like an internal standard definition. In such a case, a CSV file needs to be prepared that reflects this color standard, with the following columns:
Category (optional): name of the category to which a color definition applies
Value (mandatory): category value to which the color applies
Colors:red, Colors:green, Colors:blue (or Colors:0, Colors:1, Colors:2): color components
ColorAlpha (or Colors:alpha or Colors:3) (optional): alpha value (transparency). Note that this is only for storing a required transparency value, but transparency display will will not happen that way (and is not possible to specify explicitly with the software, only as part of color mapping)