2. Display Sampling Set
Technically, sampling sets (either single samples or drilling campaigns) are displayed as VTK Unstructured Grid, which means that what was explained about block models in Display a Block Model mostly applies to sampling sets as well.
This also refers to the possibilities to manually manipulate attributes with the Write Value, the Write Multiple Values and the Calculator filters (see Manipulating Block Model Attributes).
2.1. Single Samples in 3D
A series of single samples can be loaded from a CSV file containing a sample lable column, coordinate columns and attributes, as shown in Table 2.3.
SampleId |
SiO2 |
Al2O3 |
Fe2O3 |
CaO |
N_Unit |
Collar:X |
Collar:Y |
Collar:Z |
|---|---|---|---|---|---|---|---|---|
samp1 |
12.06 |
2.55 |
1.76 |
42.85 |
Upper Lst |
282630 |
770160 |
290 |
samp2 |
15.1 |
3.35 |
2.08 |
34.44 |
Upper Mg Lst |
282960 |
769920 |
242 |
samp3 |
11.46 |
3.05 |
1.66 |
45.97 |
Upper Lst |
282480 |
769860 |
290 |
samp4 |
14.04 |
3.74 |
1.84 |
40.67 |
Upper Mg Lst |
282780 |
769680 |
266 |
samp5 |
5.21 |
1.23 |
0.55 |
50.91 |
Lower Lst |
283050 |
769290 |
242 |
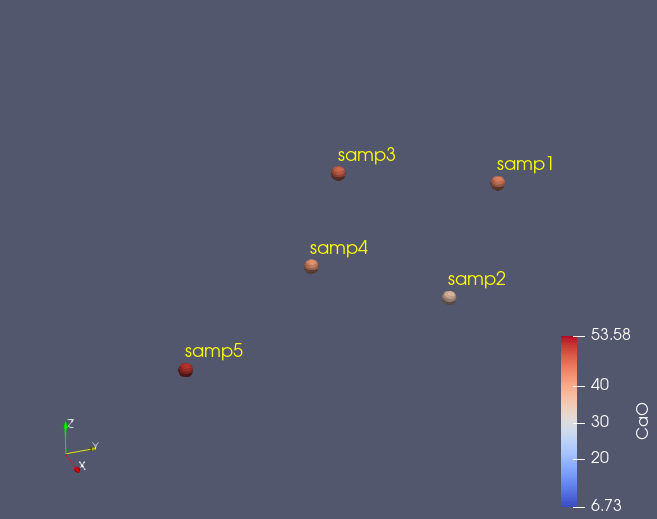
Loading this table with the SamplingReader will generate a display as shown in Fig. 2.7.

Fig. 2.7 Single samples are shown with a 3D Marker (spheres in this case) and with their sample label
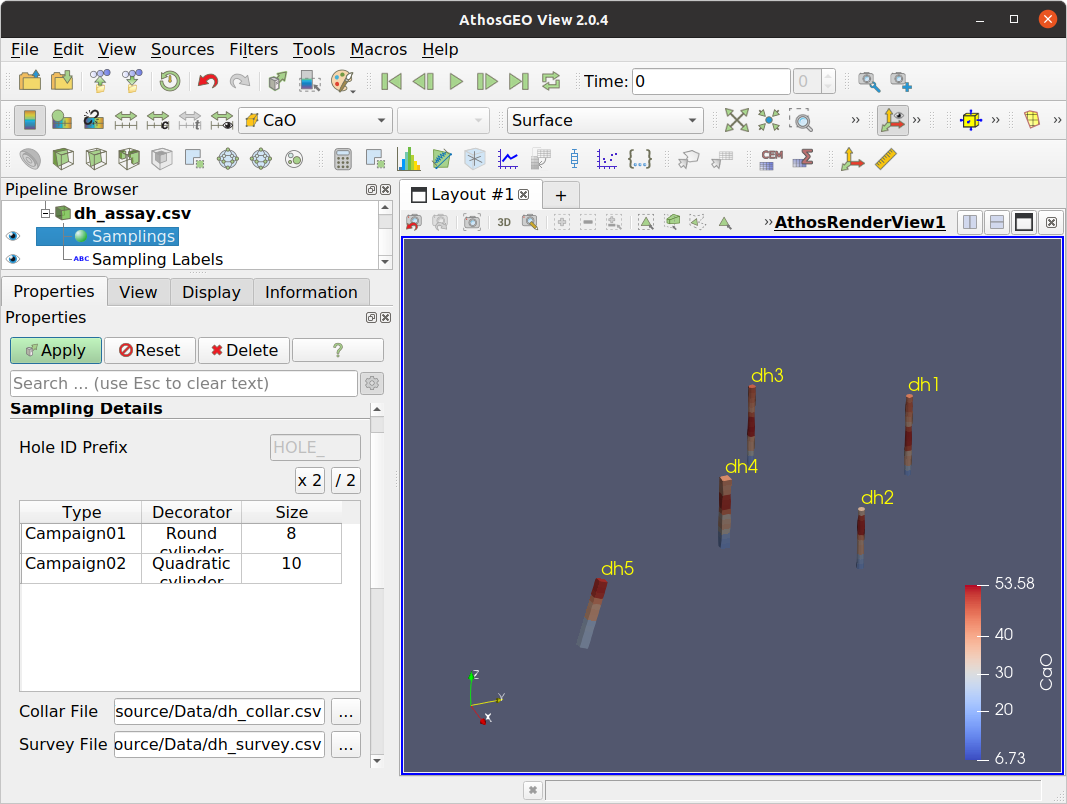
Properties for the display of the single samples can be specified in the Properties Panel as shown in Fig. 2.8.

Fig. 2.8 The Properties Panel allows to specify the type and size of the 3D Marker (sphere, cube, tetrahedron or octahedron) and it’s size.
The Pipeline Browser shows that the Sampling Reader actually generates two output data objects, which are the Samplings themselves and the Sampling Labels. This allows to show and hide the two independently.

Fig. 2.9 The Pipeline Browser for a set of samples shows two objects that can be independently shown or hidden: Samplings and Sampling Labels.
2.2. Drilling Campaign in 3D
Drilling campaigns can be read from CSV files as explained in Section 5. The main difference to the display of sets of single samples as explained in Section 2.1 are the following:
Samplings
Display options are round cylinder, quadratic cylinder, triangular cylinder and hexagonal cylinder.
Sampling Labels
These represent the HoleId attribute (and not the SampleId).
Did you know?
With a HoleType attribute it is possible, to define different display decorators for different classes of drillholes, like different drilling campaigns, see Fig. 2.10. This actually works also for sets of single samples, with the same attribute name.

Fig. 2.10 Display example of a simple drilling campaign.
2.3. Sampling Set as Points
The Cell Centers filter allows to also transform either single samples or the samples that make up drillholes into center points, for further processing like generating charts etc.
2.4. Sampling Set Charts
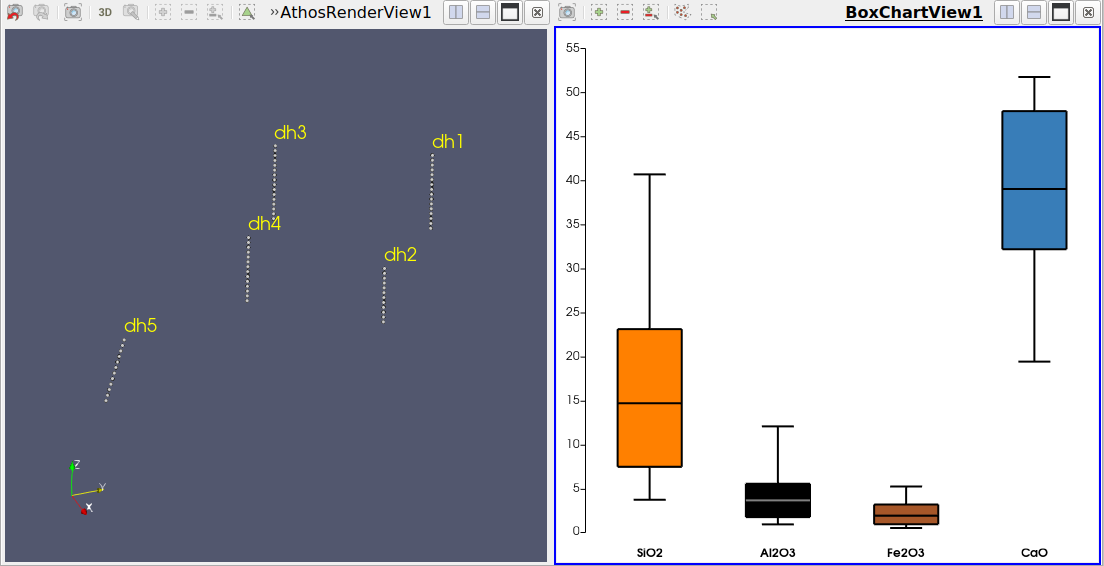
In Fig. 2.11, a series of drillholes was first converted into center points with the Cell Centers filter and then shown using the Box Chart (or Compute Quartiles) filter in a Box Chart View.

Fig. 2.11 In the left view, a set of drillholes was converted into center points, and in the right view, four chemical compounds are shown in a box chart. Note that all samples within the drillholes are having the same weight here, no matter what length of the drillhole they do represent.
2.5. Summary Table of a Sampling Set
Normally, a sampling set cannot be summarized with a Summarize Attributes filter or with an Athos Summary Table. The reason is the fact that they do not come with a Tonnage attribute that can be used to calculate the tonnage weighted means of chemical compounds and other attributes.
It might be reasonable to use the length of samples for the weighing, or if these are all the same, it could be simply the number of samples, and this can be achieved with a workaround as follows:
Generate a Tons attribute by using the Calculator filter and simply calculating Depth_To-Depth_From.
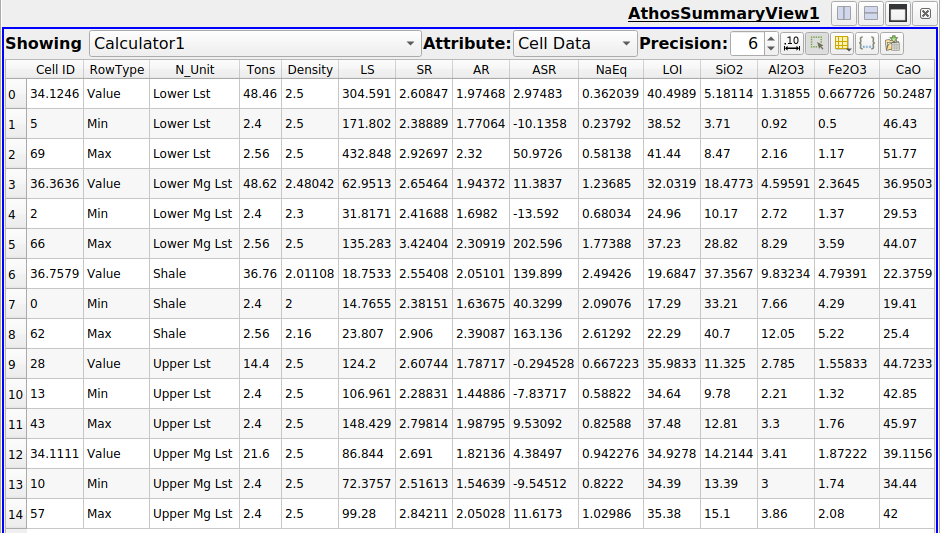
Fig. 2.12 shows the summary of an entire drilling campaign, weighted by drill hole lengths.
Fig. 2.13 shows the same thing by geological units. The formula for calculating the sample lengths was changed to (Depth_To-Depth_From)/5, meaning that it is divided by the number of drillholes. The effect is that the Tons attribute would now represent the average unit thickness (except if a unit was not completely traversed by any one of the drillholes).

Fig. 2.12 Summarized quality data of a full drilling campaign. The Tons attribute is actually length in meters

Fig. 2.13 Summarized quality data of drilling campaign by geological units. Here the Tons attribute represents average unit thickness of the respective geological unit (except for units that are not fully traversed by one or several of the drillholes).