In April 2019, Swisstopo organized for the second time a workshop about Geological 3D Modelling. Swisstopo is part of the Swiss Federal Government, and the invited parties were from authorities, universities and private companies in Switzerland. I was also invited to present, and since this was not a cement related event, I presented the AthosGEO View software.
As you can read elsewhere on this website, AthosGEO View is freely available for everybody (after subscribing). And there is a reason why I am publishing the software tool like that. Or rather two reasons, but maybe the two are at the end again only one...
First of all I thought that it is not more than fair if I am already using a phantastic software such as Paraview as a base, which is open source with no restriction in terms of commercial or non-commercial use, I should at least give something back to the community. And second I believe that a software like this one should not be monopolized by anybody, but rather be part of a global know-how pool, no other than science such as Geology, Physics, Biology etc. In other words: I would like the software to be part of a global cooperation, with users and contributors, and discussions that are beneficial for all.
It's not really so far yet, but the workshop was definitely a good opportunity to promote the tool in that sense!
The presentation was in German, and furthermore it is not very informative without explanations. What I am going to do instead of publishing the entire presentation as it is: show you some of the slides, with few words of explanation in English. Almost as if you would sit for a moment in Bern in that Swisstopo workshop with a simultaneous translator.
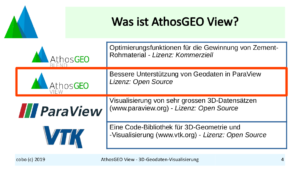
A very short overview of the software architecture - including the position of AthosGEO View. The meaning is: each one of the softwares is built directly on top of the ones below.
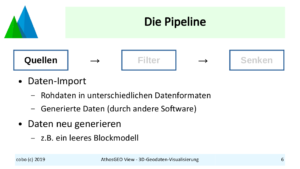
In AthosGEO View - like in Paraview -, everything is about the data pipeline. And it always starts with one or several sources (Quellen) which can be imported data (samples, block models, geometries, images etc.) or generated data (like an empty block model or a geometric element).
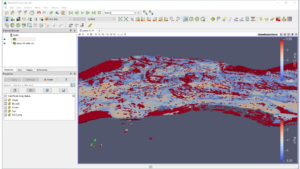
This is a set of samplings (drillholes) in space
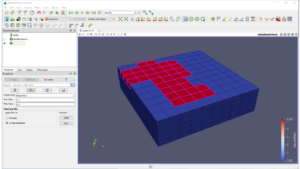
And this is the same volume, after generating a block model from the sample (with an external tool)
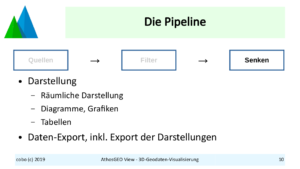
At the end of the pipeline you find the sinks (Senken), which are either differnt types of display (spacial or planar views, tables) or writers for different data formats.
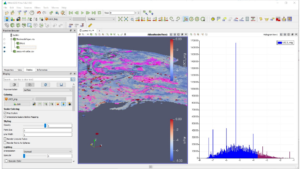
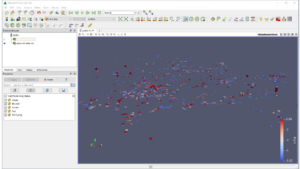
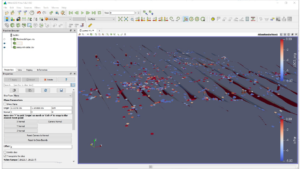
This is an example where again the same block model can be seen, both in space (3D view) and as a histogram. Note that you can select the highest "tail" of the data in the histogram (red) and automatically see the same blocks also marked in the 3D view (in pink): As long as both views refer to the same item in the data pipeline, the selections are automatically synchronized.
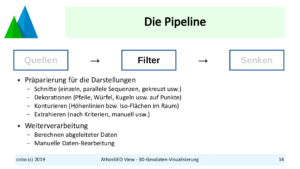
Filters is what comes in between - none, one, many - with one or several input pipes, and also one or several output pipes. They are doing more or less everything with the data - from preparing special views (cuts, decorations, contours), extracting parts of the data or all kinds of calculations, simple and complex.
Here you see a slicing filter in action that operates on the block model. In addition to the slices, you also still see the original samples in the 3D view
This is a data manipulation filter that allows some simple data editing in the block model. AthosGEO View is still not really a 3D editor - viewing remains the core business. But sometimes it is helpful if you can still do some data manipulations in directly in 3D space that would be much less obvious in a numeric table only.
With this you have now a little impression about what you can do with AthosGEO View. Please go ahead and download it from this website, and if you have questions: Just ask! As I said, my intention is to make this tool part of a global community of users, contributers and user-contributors.
And what did I learn from that workshop myself?
I saw that for quite a number of participants, AthosGEO View was interesting for it's ability to simultaneously visualize both geometric data (like geological unit boundaries, topo surfaces, boundary lines, maps and images) and quality data (like block models and samplings).
So much for today! Next time I will tell you about another conference where I had the opportunity to present.